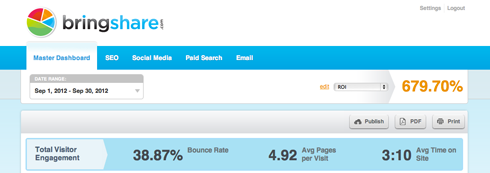
The Master Dashboard is the solution to all of your marketing frustration. We bring all your internet marketing together here and provide you with actionable information on how each of your marketing channels are performing as a whole, allowing you to easily compare and contrast their performance against each other.
The BringShare Master Internet Marketing Dashboard is the place where all of your digital marketing channels are brought together. In a single dashboard, you can compare how Social Media Marketing, Search Engine Optimization, Paid Search and Email Marketing are performing in comparison to one-another. You can also view how your website is performing as a whole with BringShare’s grand total.
The dashboard also allows Visits, Conversions/Sales and Conversion Rates for each individual internet marketing channel to be easily viewed and compared through trend graphs -over anytime or date range.
Finally, the BringShare Master Dashboard can be easily printed or generated into a link/PDF to report your digital marketing results with a single click.

BringShare pulls in all of your important digital marketing from Google , Google AdWords, Facebook, Twitter, your 3rd party email provider (Constant Contact or MailChimp), and Search Engine Optimization rank-tracking APIs and displays it to you in a single, easy-to-use internet marketing dashboard.
We filter this data so you don’t have to, providing you with all the critical internet marketing you could ever need and not an ounce more.

Understand how your individual digital marketing channels as a whole trend over time and compare to one-another

View your digital marketing results by any date range
Want results from Q1? Not a problem. Results from last month -last week? It’s all just a click away
Quickly glance at the master dashboard to understand which marketing channels are succeeding and which channels are falling short
Easily determine digital marketing strategy: Is Social Media trending downward? Maybe you should contact your Social Media specialist; See SEO sales trending upward? Contact your SEO consultant to let him know whatever he’s doing has been working