How quickly can you calculate the number of visitors you received last week from Facebook, Twitter, YouTube, Pinterest and all the other social networks combined? Do you know if they are engaging, liking, following or buying you products? BringShare’s Social Media Dashboard puts that valuable data in your hands in seconds.
Our Social Media Dashboard brings together all of your different social media marketing into a beautiful, easy to use dashboard
Easily prints or generates a PDF of all Social Media Dashboard for quick and easy Social Media Reporting
BringShare integrates with Facebook, Twitter and Google in order to pull in all of your social media marketing to one place
BringShare pulls in everything from Facebook likes and Twitter followers to websites visits and sales driven by Pinterest, Google+, Youtube and more
Our Social Media Marketing Dashboard includes data from Facebook, Twitter, Pinterest, YouTube, Google+, MySpace and LinkedIn
Understand how your social media marketing is performing as a whole through the “Total Performance Summary”
BringShare easily allows you to see -in one aggregated view, how Facebook, Twitter, Pinterest, YouTube, LinkedIn and MySpace are driving sales revenue, conversions and transactions.
Up until now, you have had to manually manipulate a sea of data to get the kind of total social media perspective that BringShare provides with just the click of a button
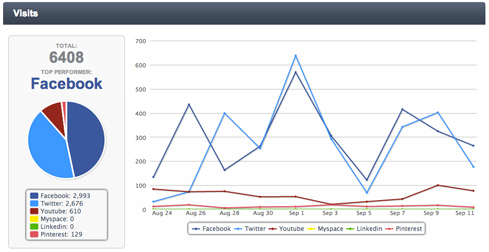
Compare how individual social media channels trend over time in terms of visits, sales revenue, conversions, visit value and conversion rate
Compare each social media channel against one another
This section allows you to easily pick out social media channel trends, enabling you to quickly and easily see which channels have the highest sales and revenue, and compare to each individual social media channel’s visit value and conversion rate.
View how Facebook trends vs Twitter, how Pinterest affects your digital marketing compared to YouTube, LinkedIn or Google+ and much more.
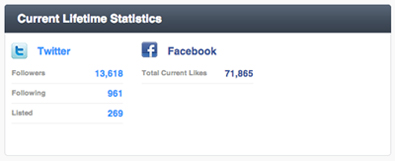
View current lifetime statistics for Twitter and Facebook
Total Twitter followers
Total current Facebook likes
The number of people following you on Twitter
The amount of places you are listed on Twitter
Understand how Facebook is driving value to your website
Pinpoint days where you are gaining or losing the most Facebook likes to understand how to continue to drive growth
View how “Unique Engaged Users”, Facebook Impressions, visits to your website driven by Facebook and Sales driven by Facebook compare across time in our beautiful trending graphs
View how “New Likes”, “Lifetime Likes” and “People Talking about This (or PTAT)” trend over time
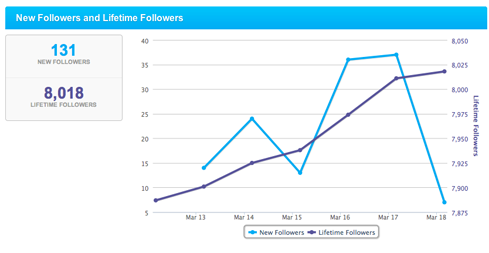
Know your Twitter statistics and how they trend over time
View new Twitter followers vs Lifetime Twitter followers and be able to quickly identify days or periods of time where you’re losing more Twitter followers than you are gaining
View visits and conversions or sales on your website that are driven by users who landed on your website from Twitter.